中国临床药理学与治疗学 ›› 2026, Vol. 31 ›› Issue (9): 1238-1248.doi: 10.12092/j.issn.1009-2501.2026.09.010
• 临床药理学 • 上一篇
吴诗雅1,2( ), 刘晓丹3, 胡妍1, 林琦1,2,3,*()
收稿日期:2025-07-10
修回日期:2025-09-28
出版日期:2026-09-26
发布日期:2026-10-08
通讯作者:
林琦
E-mail:736889128@qq.com;linqitc@hotmail.com
作者简介:吴诗雅,硕士生在读,研究方向:临床试验数据分析研究。E-mail:基金资助:
Shiya WU1,2(), Xiaodan LIU3, Yan HU1, Qi LIN1,2,3,*()
Received:2025-07-10
Revised:2025-09-28
Online:2026-09-26
Published:2026-10-08
Contact:
Qi LIN
E-mail:736889128@qq.com;linqitc@hotmail.com
摘要:
目的: 建立人血浆中替加环素的高效液相色谱-串联质谱(HPLC-MS/MS)测定方法,用于研究患者体内的药代动力学特征,并探讨其血药浓度与药物诱导性肝损伤及凝血功能障碍的相关性。方法: 采用蛋白沉淀法处理血浆,以Eclipse Plus C18柱分离,0.1%甲酸水-甲醇梯度洗脱,利血平为内标,流速0.3 mL/min,正离子模式检测并考察方法各项性能。随后,收集2024年6月至2025年6月期间使用替加环素患者的临床资料与血浆样本(n=72)。根据是否发生不良反应(ADR)分组,比较两组血药浓度差异,采用受试者工作特征曲线(ROC)分析确定ADR发生的血药浓度折点,并计算敏感度、特异度及曲线下面积(AUC)。结果: 所建方法线性范围为50~5 000 ng/mL,精密度、准确度及稳定性值均小于10%,满足临床检测要求。通过ROC曲线得到替加环素导致肝损伤的折点为515.34 ng/mL,致凝血功能障碍的折点为243.59 ng/mL。结论: 成功建立人血浆中替加环素的HPLC-MS/MS方法,替加环素的血药浓度与导致肝损伤及凝血功能障碍有关,建议临床上应联合血药浓度与肝功能、凝血指标监测以守护用药安全。
中图分类号:
吴诗雅, 刘晓丹, 胡妍, 林琦. 替加环素血药浓度监测与不良反应的关联性分析[J]. 中国临床药理学与治疗学, 2026, 31(9): 1238-1248.
Shiya WU, Xiaodan LIU, Yan HU, Qi LIN. Correlation analysis between tigecycline therapeutic concentration monitoring and adverse reactions[J]. Chinese Journal of Clinical Pharmacology and Therapeutics, 2026, 31(9): 1238-1248.
| Compound | Ion pair type | Precursor Ion (m/z) | Product Ion (m/z) | Exit voltage (V) | Collision energy (eV) |
| TGC | Quantitative ion-pairing | 586.3 | 513.1 | 180 | 30 |
| Qualitative ion pair | 586.3 | 569.2 | 180 | 20 | |
| Reserpine | Quantitative ion-pairing | 609.2 | 195.0 | 110 | 40 |
| Qualitative ion pair | 609.2 | 173.4 | 110 | 50 |
表 1
Table 1 MRM mass spectrometry parameters of TGC and reserpine
| Compound | Ion pair type | Precursor Ion (m/z) | Product Ion (m/z) | Exit voltage (V) | Collision energy (eV) |
| TGC | Quantitative ion-pairing | 586.3 | 513.1 | 180 | 30 |
| Qualitative ion pair | 586.3 | 569.2 | 180 | 20 | |
| Reserpine | Quantitative ion-pairing | 609.2 | 195.0 | 110 | 40 |
| Qualitative ion pair | 609.2 | 173.4 | 110 | 50 |
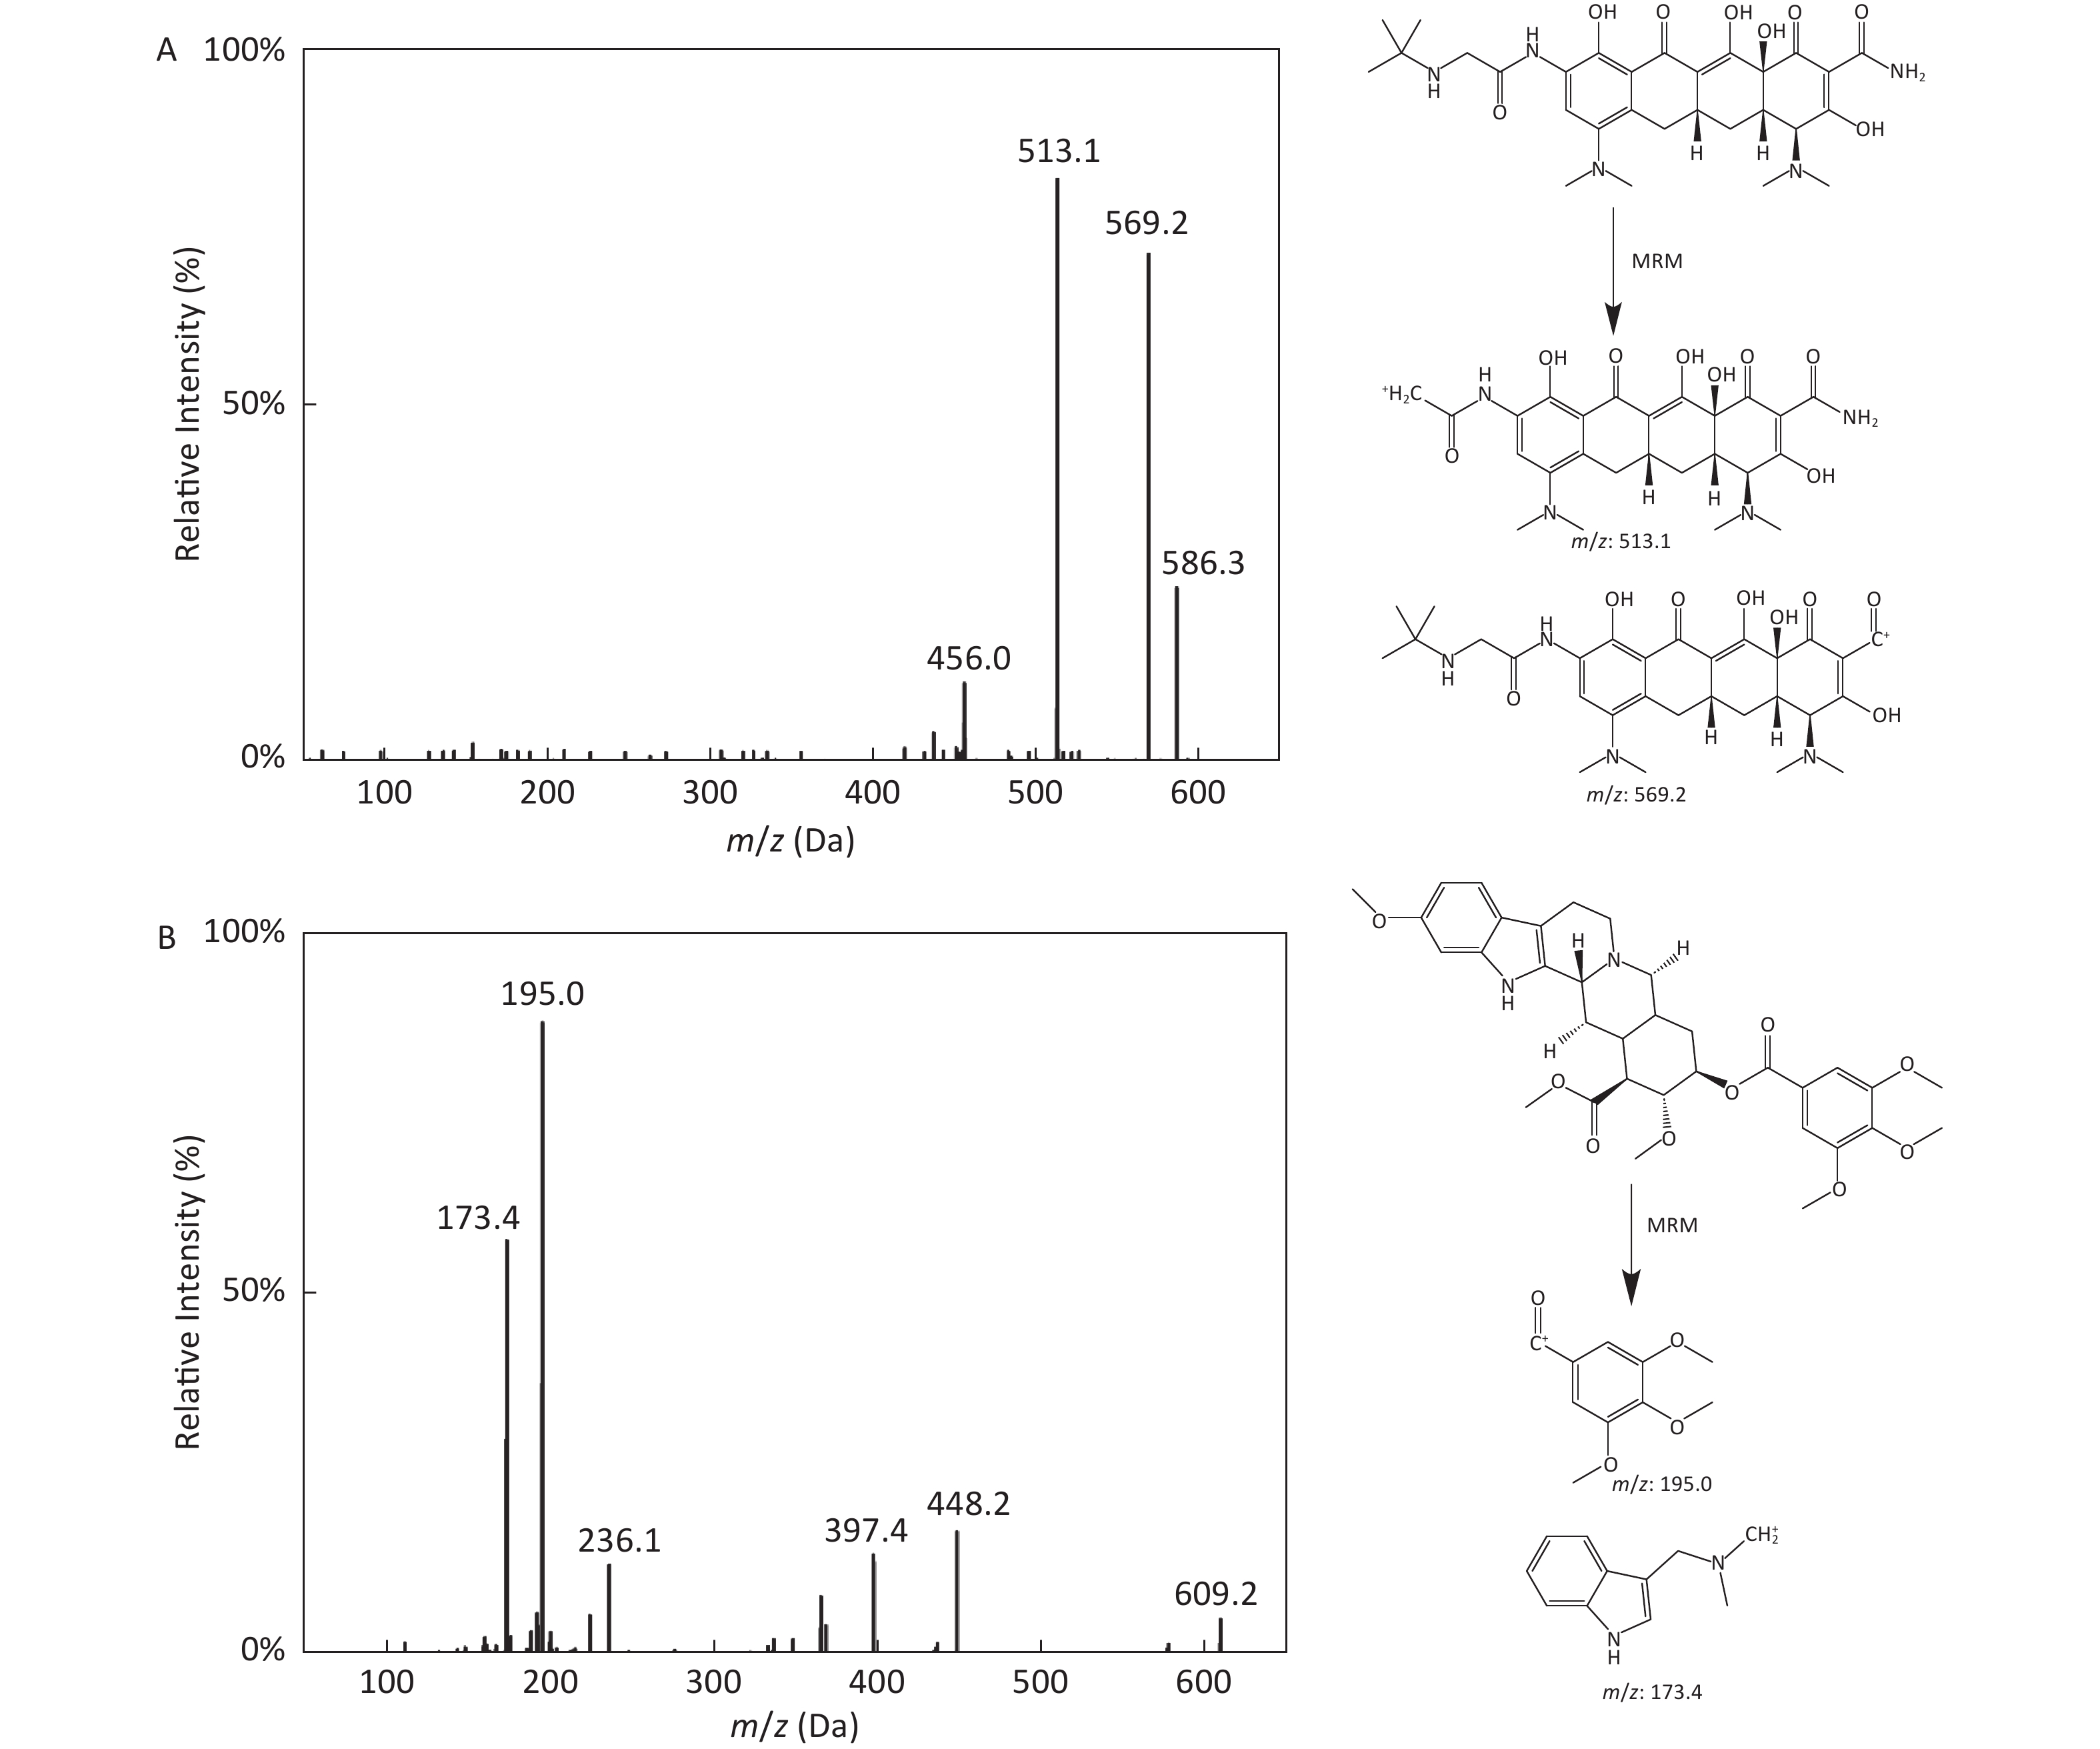
图 1
Fig.1 Product ion mass spectra of (A) TGC and (B) reserpine
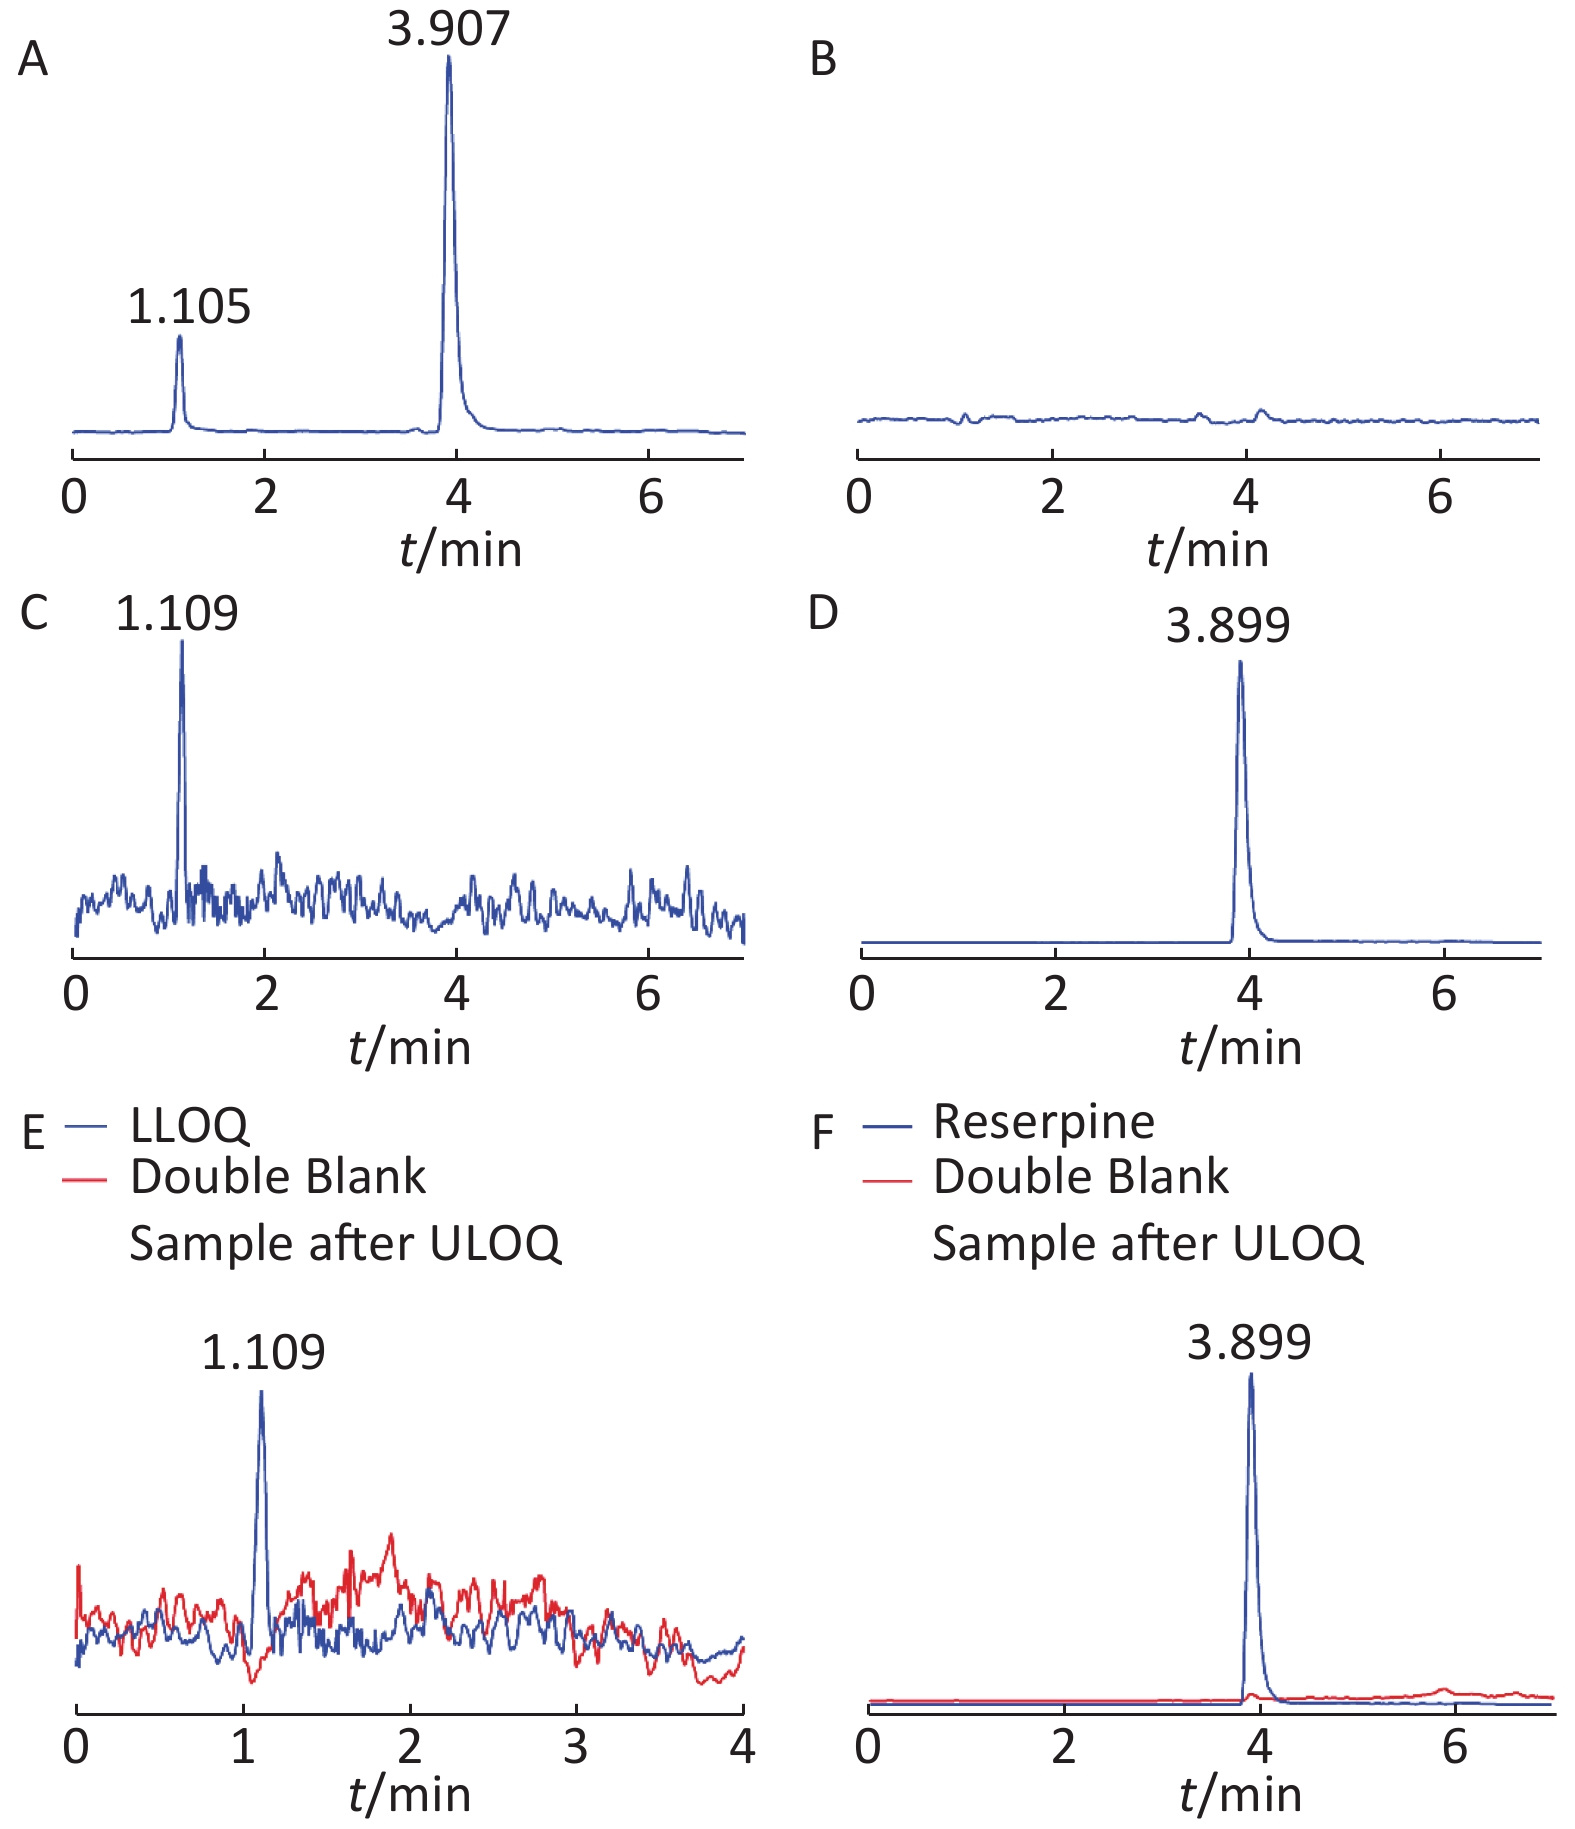
图 2
Fig.2 (A) Clinical plasma sample; (B) Double blank plasma; (C) Blank plasma added to LLOQ sample; (D) Blank plasma added to internal standard; (E,F) ULOQ post-blank sample.
| Nominal Concentration (ng/mL) | Run 1 | Run 2 | Run 3 | |
| ? | ||||
| 50 | ||||
| 100 | ||||
| 200 | ||||
| 500 | ||||
| 2000 | ||||
| Parameter | a | |||
| b | ? | |||
| r | ||||
表 2
Table 2 Standard curve of TGC in human plasma measured by HPLC-MS/MS (n=3)
| Nominal Concentration (ng/mL) | Run 1 | Run 2 | Run 3 | |
| ? | ||||
| 50 | ||||
| 100 | ||||
| 200 | ||||
| 500 | ||||
| 2000 | ||||
| Parameter | a | |||
| b | ? | |||
| r | ||||
| Batch | LLOQ (50 ng/mL) | Accuracy | LQC1 (150 ng/mL) | Accuracy | LQC2 (750 ng/mL) | Accuracy | MQC ( ng/mL) | Accuracy | HQC ( ng/mL) | Accuracy |
| First batch | 49.42 | 98.84 | 152.72 | 101.81 | 757.74 | 101.03 | 102.35 | 99.81 | ||
| 51.13 | 102.26 | 150.63 | 100.42 | 756.50 | 100.87 | 100.53 | 100.19 | |||
| 48.73 | 97.46 | 156.20 | 104.13 | 747.38 | 99.65 | 102.16 | 100.22 | |||
| 49.58 | 99.16 | 151.84 | 101.23 | 757.59 | 101.01 | 101.30 | 100.39 | |||
| 52.13 | 104.26 | 148.94 | 99.29 | 756.22 | 100.83 | 102.45 | 101.96 | |||
| Mean | 50.20 | 152.07 | 755.09 | |||||||
| SD | 1.39 | 2.71 | 4.36 | 24.72 | 37.62 | |||||
| Intra-batch CV% | 2.77 | 1.78 | 0.58 | 0.81 | 0.83 | |||||
| Intra-batch Accuracy (%) | 0.40 | 1.38 | 3.39 | 1.76 | 0.51 | |||||
| Second batch | 51.70 | 103.40 | 152.91 | 101.94 | 748.01 | 99.73 | 102.71 | 98.28 | ||
| 49.97 | 99.94 | 149.16 | 99.44 | 747.89 | 99.72 | 102.00 | 100.41 | |||
| 52.32 | 104.64 | 146.54 | 97.69 | 759.12 | 101.22 | 100.54 | 99.31 | |||
| 49.12 | 98.24 | 151.29 | 100.86 | 755.76 | 100.77 | 98.22 | 101.62 | |||
| 52.36 | 104.72 | 149.57 | 99.71 | 750.76 | 100.10 | 98.09 | 100.58 | |||
| Mean | 51.09 | 149.89 | 752.31 | |||||||
| SD | 1.47 | 2.39 | 4.97 | 63.56 | 57.59 | |||||
| Intra-batch CV% | 2.88 | 1.60 | 0.66 | 2.11 | 1.28 | |||||
| Intra-batch Accuracy (%) | 2.19 | ?0.07 | 1.54 | 0.31 | 0.04 | |||||
| Third batch | 48.35 | 96.70 | 156.43 | 104.29 | 758.76 | 101.17 | 103.26 | 102.04 | ||
| 53.94 | 107.88 | 156.02 | 104.01 | 745.76 | 99.43 | 102.86 | 101.82 | |||
| 54.09 | 108.18 | 148.81 | 99.21 | 745.76 | 99.43 | 96.67 | 99.70 | |||
| 53.09 | 106.18 | 148.59 | 99.06 | 757.76 | 101.03 | 99.09 | 100.61 | |||
| 53.04 | 106.08 | 153.26 | 102.17 | 754.76 | 100.63 | 100.07 | 102.10 | |||
| Mean | 52.50 | 152.62 | 752.56 | |||||||
| SD | 2.37 | 3.78 | 6.38 | 82.07 | 47.68 | |||||
| Intra-batch CV% | 4.51 | 2.48 | 0.85 | 2.73 | 1.05 | |||||
| Intra-batch Accuracy (%) | 5.00 | 1.75 | 1.71 | 0.39 | 1.25 | |||||
| Mean Calculated Concentration | 51.26 | 151.53 | 753.32 | |||||||
| Inter-batch CV% | 3.77 | 2.01 | 0.67 | 2.01 | 1.11 | |||||
| Intra-batch accuracy (%) | 2.53 | 1.02 | 2.21 | 0.82 | 0.60 |
表 3
Table 3 Accuracy and precision of TGC in human plasma
| Batch | LLOQ (50 ng/mL) | Accuracy | LQC1 (150 ng/mL) | Accuracy | LQC2 (750 ng/mL) | Accuracy | MQC ( ng/mL) | Accuracy | HQC ( ng/mL) | Accuracy |
| First batch | 49.42 | 98.84 | 152.72 | 101.81 | 757.74 | 101.03 | 102.35 | 99.81 | ||
| 51.13 | 102.26 | 150.63 | 100.42 | 756.50 | 100.87 | 100.53 | 100.19 | |||
| 48.73 | 97.46 | 156.20 | 104.13 | 747.38 | 99.65 | 102.16 | 100.22 | |||
| 49.58 | 99.16 | 151.84 | 101.23 | 757.59 | 101.01 | 101.30 | 100.39 | |||
| 52.13 | 104.26 | 148.94 | 99.29 | 756.22 | 100.83 | 102.45 | 101.96 | |||
| Mean | 50.20 | 152.07 | 755.09 | |||||||
| SD | 1.39 | 2.71 | 4.36 | 24.72 | 37.62 | |||||
| Intra-batch CV% | 2.77 | 1.78 | 0.58 | 0.81 | 0.83 | |||||
| Intra-batch Accuracy (%) | 0.40 | 1.38 | 3.39 | 1.76 | 0.51 | |||||
| Second batch | 51.70 | 103.40 | 152.91 | 101.94 | 748.01 | 99.73 | 102.71 | 98.28 | ||
| 49.97 | 99.94 | 149.16 | 99.44 | 747.89 | 99.72 | 102.00 | 100.41 | |||
| 52.32 | 104.64 | 146.54 | 97.69 | 759.12 | 101.22 | 100.54 | 99.31 | |||
| 49.12 | 98.24 | 151.29 | 100.86 | 755.76 | 100.77 | 98.22 | 101.62 | |||
| 52.36 | 104.72 | 149.57 | 99.71 | 750.76 | 100.10 | 98.09 | 100.58 | |||
| Mean | 51.09 | 149.89 | 752.31 | |||||||
| SD | 1.47 | 2.39 | 4.97 | 63.56 | 57.59 | |||||
| Intra-batch CV% | 2.88 | 1.60 | 0.66 | 2.11 | 1.28 | |||||
| Intra-batch Accuracy (%) | 2.19 | ?0.07 | 1.54 | 0.31 | 0.04 | |||||
| Third batch | 48.35 | 96.70 | 156.43 | 104.29 | 758.76 | 101.17 | 103.26 | 102.04 | ||
| 53.94 | 107.88 | 156.02 | 104.01 | 745.76 | 99.43 | 102.86 | 101.82 | |||
| 54.09 | 108.18 | 148.81 | 99.21 | 745.76 | 99.43 | 96.67 | 99.70 | |||
| 53.09 | 106.18 | 148.59 | 99.06 | 757.76 | 101.03 | 99.09 | 100.61 | |||
| 53.04 | 106.08 | 153.26 | 102.17 | 754.76 | 100.63 | 100.07 | 102.10 | |||
| Mean | 52.50 | 152.62 | 752.56 | |||||||
| SD | 2.37 | 3.78 | 6.38 | 82.07 | 47.68 | |||||
| Intra-batch CV% | 4.51 | 2.48 | 0.85 | 2.73 | 1.05 | |||||
| Intra-batch Accuracy (%) | 5.00 | 1.75 | 1.71 | 0.39 | 1.25 | |||||
| Mean Calculated Concentration | 51.26 | 151.53 | 753.32 | |||||||
| Inter-batch CV% | 3.77 | 2.01 | 0.67 | 2.01 | 1.11 | |||||
| Intra-batch accuracy (%) | 2.53 | 1.02 | 2.21 | 0.82 | 0.60 |
| Stability conditions | Nominal concentration (ng/mL) | Measured concentration (ng/mL) | Mean | Deviation (%) | ||
| Sample 1 | Sample 2 | Sample 3 | ||||
| Room temperature (24 h) | 150 | 154.97 | 149.59 | 158.89 | 154.48 | 2.99 |
| 0.86 | ||||||
| 4 °C storage (24 h) | 150 | 156.53 | 148.39 | 165.16 | 156.69 | 4.46 |
| ?1.85 | ||||||
| ?80 °C freeze-thaw 5 times | 150 | 154.50 | 146.01 | 144.54 | 148.35 | ?1.1 |
| 0.23 | ||||||
| ?80 °C for 30 days | 150 | 163.38 | 167.52 | 152.72 | 161.21 | 7.47 |
| 3.46 | ||||||
表 4
Table 4 Stability of TGC in human plasma under various storage conditions
| Stability conditions | Nominal concentration (ng/mL) | Measured concentration (ng/mL) | Mean | Deviation (%) | ||
| Sample 1 | Sample 2 | Sample 3 | ||||
| Room temperature (24 h) | 150 | 154.97 | 149.59 | 158.89 | 154.48 | 2.99 |
| 0.86 | ||||||
| 4 °C storage (24 h) | 150 | 156.53 | 148.39 | 165.16 | 156.69 | 4.46 |
| ?1.85 | ||||||
| ?80 °C freeze-thaw 5 times | 150 | 154.50 | 146.01 | 144.54 | 148.35 | ?1.1 |
| 0.23 | ||||||
| ?80 °C for 30 days | 150 | 163.38 | 167.52 | 152.72 | 161.21 | 7.47 |
| 3.46 | ||||||
| Nominal concentration (ng/mL) | Normal plasma | |
| Drug matrix factor (%) | Internal standard normalization factor (%) | |
| 150 | 63.39±3.12 | 69.01±3.32 |
| 59.73±4.02 | 68.43±5.75 | |
| CV% | 4.2 | 0.60 |
表 5
Table 5 Matrix effects of TGC in the plasma matrix
| Nominal concentration (ng/mL) | Normal plasma | |
| Drug matrix factor (%) | Internal standard normalization factor (%) | |
| 150 | 63.39±3.12 | 69.01±3.32 |
| 59.73±4.02 | 68.43±5.75 | |
| CV% | 4.2 | 0.60 |
| Parameters | TGC (n=10) |
| AUC0-12h (mg·L?1·h) | 2.36±0.51 (21.8%) |
| AUC0-∞ (mg·L?1·h) | 3.57±0.52 (14.7%) |
| T1/2 (h) | 7.71±2.82 (36.5%) |
| CL (L/h) | 22.36±6.42 (28.7%) |
| Vd (L) | 265.10±164.16 (61.9%) |
| Cmax (μg/mL) | 0.44±0.18 (39.9%) |
表 6
Table 6 Pharmacokinetic parameters of TGC in humans and their variability
| Parameters | TGC (n=10) |
| AUC0-12h (mg·L?1·h) | 2.36±0.51 (21.8%) |
| AUC0-∞ (mg·L?1·h) | 3.57±0.52 (14.7%) |
| T1/2 (h) | 7.71±2.82 (36.5%) |
| CL (L/h) | 22.36±6.42 (28.7%) |
| Vd (L) | 265.10±164.16 (61.9%) |
| Cmax (μg/mL) | 0.44±0.18 (39.9%) |
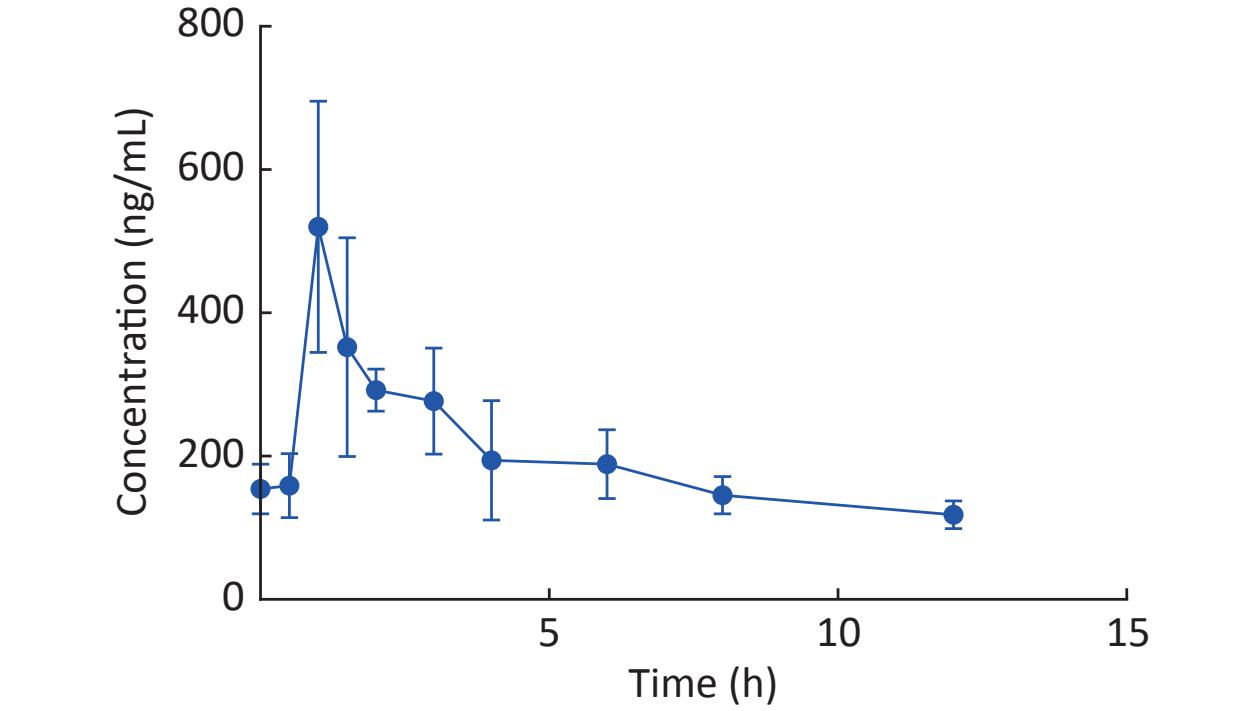
图 3
Fig.3 Pharmacokinetic parameters of TGC in humans
| Variables | Total (n=72) | Liver injury research sample | Coagulation disorders research sample | |||
| Control group (n=63) | Liver injury group (n=9) | Control group (n=39) | Coagulation disorders group (n=33) | |||
| Age | 72.00 (66.75, 79.00) | 72.00 (66.50, 79.00) | 72.00 (67.00, 77.00) | 72.00 (66.50, 77.50) | 72.00 (67.00, 81.00) | |
| BMI (kg/m2) | 22.65 (19.29, 24.36) | 22.19 (19.23, 23.95) | 23.63 (20.76, 27.29) | 23.59 (20.06, 24.55) | 21.26 (18.61, 23.85) | |
| Treatment/day | 7.93 (5.77, 12.59) | 7.88 (5.83, 12.29) | 8.66 (5.77, 14.27) | 7.98 (5.83, 11.61) | 7.01 (5.77, 12.61) | |
| Blood concentration | 261.06 (161.62, 499.33) | 234.52 (143.98, 340.29) | 845.08 (713.46, 935.40) | 165.30 (117.02, 233.12) | 446.40 (284.70, 713.46) | |
| Gender [n(%)] | ||||||
| Male | 61 (84.72) | 54 (85.71) | 7 (77.78) | 34 (87.18) | 27 (81.82) | |
| Female | 11 (15.28) | 9 (14.29) | 2 (22.22) | 5 (12.82) | 6 (18.18) | |
| Complication [n(%] | ||||||
| Hypertension | 29 (40.28) | 25 (39.68) | 4 (44.44) | 15 (38.46) | 14 (42.42) | |
| Diabetes | 15 (20.83) | 12 (19.05) | 3 (33.33) | 6 (15.38) | 9 (27.27) | |
| CHD | 3 (4.17) | 3 (4.76) | 0 (0.00) | 1 (2.56) | 2 (6.06) | |
| MT | 16 (22.22) | 15 (23.81) | 1 (11.11) | 8 (20.51) | 8 (24.24) | |
| Histology [n(%)] | ||||||
| Drinking | 9 (12.50) | 8 (12.70) | 1 (11.11) | 7 (17.95) | 2 (6.06) | |
| Smoking | 4 (5.56) | 4 (6.35) | 0 (0.00) | 4 (10.26) | 0 (0.00) | |
| Drug combination [n(%)] | ||||||
| Cefoperazone sulbactam | 23 (31.94) | 20 (31.75) | 3 (33.33) | 16 (41.03) | 7 (21.21) | |
| Meropenem | 32 (44.44) | 29 (46.03) | 3 (33.33) | 17 (43.59) | 15 (45.45) | |
| Polymyxin b | 4 (5.56) | 3 (4.76) | 1 (11.11) | 3 (7.69) | 1 (3.03) | |
| Piperacillin sulbactam | 9 (12.50) | 8 (12.70) | 1 (11.11) | 4 (10.26) | 5 (15.15) | |
| Site and type of infection [n(%)] | ||||||
| Lung | 58 (80.56) | 50 (79.37) | 8 (88.89) | 33 (84.62) | 25 (75.76) | |
| Abdominal cavity | 7 (9.72) | 7 (11.11) | 0 (0.00) | 1 (2.56) | 6 (18.18) | |
| Skin | 3 (4.17) | 2 (3.17) | 1 (11.11) | 1 (2.56) | 2 (6.06) | |
| Bacterium [n(%)] | ||||||
| Acinetobacter baumannii | 8 (11.11) | 6 (9.52) | 2 (22.22) | 5 (12.82) | 3 (9.09) | |
| Klebsiella pneumoniae | 8 (11.11) | 7 (11.11) | 1 (11.11) | 4 (10.26) | 4 (12.12) | |
| E. coli | 3 (4.17) | 3 (4.76) | 0 (0.00) | 0 (0.00) | 3 (9.09) | |
| Staphylococcus aureus | 2 (2.78) | 2 (3.17) | 0 (0.00) | 2 (5.13) | 0 (0.00) | |
| AST (U/L) | 14.30 (8.45, 26.00) | 14.40 (8.90, 25.00) | 13.50 (4.70, 32.30) | 15.00 (9.00, 22.95) | 13.60 (7.50, 32.80) | |
| ALP (U/L) | 82.00 (58.27, 117.00) | 75.30 (55.60, 117.00) | 99.00 (82.00, 106.00) | 82.00 (62.00, 117.00) | 78.00 (54.20, 106.00) | |
| TBIL (μmol/L) | 4.75 (3.18, 7.93) | 4.80 (3.35, 7.95) | 3.90 (2.70, 4.80) | 4.30 (3.10, 7.95) | 4.80 (3.20, 7.40) | |
| PLT (109/L) | 184.00 (125.25, 269.50) | 184.00 (124.50, 251.50) | 165.00 (131.00, 303.00) | 184.00 (121.00, 274.50) | 174.00 (131.00, 234.00) | |
| FIB (g/L) | 4.54 (3.26, 6.19) | 4.56 (3.16, 6.04) | 4.52 (3.63, 6.58) | 5.06 (3.59, 6.68) | 4.29 (3.07, 5.32) | |
| PT (s) | 12.00 (11.00, 13.20) | 12.10 (11.05, 13.38) | 11.60 (10.90, 12.90) | 11.90 (10.85, 13.78) | 12.20 (11.60, 13.10) | |
| APTT (s) | 26.05 (23.37, 29.83) | 26.00 (23.35, 29.65) | 27.10 (23.70, 29.80) | 26.30 (23.40, 31.10) | 25.90 (23.40, 28.60) | |
| INR | 1.05 (0.95, 1.16) | 1.05 (0.95, 1.16) | 1.01 (0.95, 1.13) | 1.05 (0.94, 1.33) | 1.06 (1.01, 1.13) | |
表 7
Table 7 Basic information and general clinical characteristics of the two groups of patients
| Variables | Total (n=72) | Liver injury research sample | Coagulation disorders research sample | |||
| Control group (n=63) | Liver injury group (n=9) | Control group (n=39) | Coagulation disorders group (n=33) | |||
| Age | 72.00 (66.75, 79.00) | 72.00 (66.50, 79.00) | 72.00 (67.00, 77.00) | 72.00 (66.50, 77.50) | 72.00 (67.00, 81.00) | |
| BMI (kg/m2) | 22.65 (19.29, 24.36) | 22.19 (19.23, 23.95) | 23.63 (20.76, 27.29) | 23.59 (20.06, 24.55) | 21.26 (18.61, 23.85) | |
| Treatment/day | 7.93 (5.77, 12.59) | 7.88 (5.83, 12.29) | 8.66 (5.77, 14.27) | 7.98 (5.83, 11.61) | 7.01 (5.77, 12.61) | |
| Blood concentration | 261.06 (161.62, 499.33) | 234.52 (143.98, 340.29) | 845.08 (713.46, 935.40) | 165.30 (117.02, 233.12) | 446.40 (284.70, 713.46) | |
| Gender [n(%)] | ||||||
| Male | 61 (84.72) | 54 (85.71) | 7 (77.78) | 34 (87.18) | 27 (81.82) | |
| Female | 11 (15.28) | 9 (14.29) | 2 (22.22) | 5 (12.82) | 6 (18.18) | |
| Complication [n(%] | ||||||
| Hypertension | 29 (40.28) | 25 (39.68) | 4 (44.44) | 15 (38.46) | 14 (42.42) | |
| Diabetes | 15 (20.83) | 12 (19.05) | 3 (33.33) | 6 (15.38) | 9 (27.27) | |
| CHD | 3 (4.17) | 3 (4.76) | 0 (0.00) | 1 (2.56) | 2 (6.06) | |
| MT | 16 (22.22) | 15 (23.81) | 1 (11.11) | 8 (20.51) | 8 (24.24) | |
| Histology [n(%)] | ||||||
| Drinking | 9 (12.50) | 8 (12.70) | 1 (11.11) | 7 (17.95) | 2 (6.06) | |
| Smoking | 4 (5.56) | 4 (6.35) | 0 (0.00) | 4 (10.26) | 0 (0.00) | |
| Drug combination [n(%)] | ||||||
| Cefoperazone sulbactam | 23 (31.94) | 20 (31.75) | 3 (33.33) | 16 (41.03) | 7 (21.21) | |
| Meropenem | 32 (44.44) | 29 (46.03) | 3 (33.33) | 17 (43.59) | 15 (45.45) | |
| Polymyxin b | 4 (5.56) | 3 (4.76) | 1 (11.11) | 3 (7.69) | 1 (3.03) | |
| Piperacillin sulbactam | 9 (12.50) | 8 (12.70) | 1 (11.11) | 4 (10.26) | 5 (15.15) | |
| Site and type of infection [n(%)] | ||||||
| Lung | 58 (80.56) | 50 (79.37) | 8 (88.89) | 33 (84.62) | 25 (75.76) | |
| Abdominal cavity | 7 (9.72) | 7 (11.11) | 0 (0.00) | 1 (2.56) | 6 (18.18) | |
| Skin | 3 (4.17) | 2 (3.17) | 1 (11.11) | 1 (2.56) | 2 (6.06) | |
| Bacterium [n(%)] | ||||||
| Acinetobacter baumannii | 8 (11.11) | 6 (9.52) | 2 (22.22) | 5 (12.82) | 3 (9.09) | |
| Klebsiella pneumoniae | 8 (11.11) | 7 (11.11) | 1 (11.11) | 4 (10.26) | 4 (12.12) | |
| E. coli | 3 (4.17) | 3 (4.76) | 0 (0.00) | 0 (0.00) | 3 (9.09) | |
| Staphylococcus aureus | 2 (2.78) | 2 (3.17) | 0 (0.00) | 2 (5.13) | 0 (0.00) | |
| AST (U/L) | 14.30 (8.45, 26.00) | 14.40 (8.90, 25.00) | 13.50 (4.70, 32.30) | 15.00 (9.00, 22.95) | 13.60 (7.50, 32.80) | |
| ALP (U/L) | 82.00 (58.27, 117.00) | 75.30 (55.60, 117.00) | 99.00 (82.00, 106.00) | 82.00 (62.00, 117.00) | 78.00 (54.20, 106.00) | |
| TBIL (μmol/L) | 4.75 (3.18, 7.93) | 4.80 (3.35, 7.95) | 3.90 (2.70, 4.80) | 4.30 (3.10, 7.95) | 4.80 (3.20, 7.40) | |
| PLT (109/L) | 184.00 (125.25, 269.50) | 184.00 (124.50, 251.50) | 165.00 (131.00, 303.00) | 184.00 (121.00, 274.50) | 174.00 (131.00, 234.00) | |
| FIB (g/L) | 4.54 (3.26, 6.19) | 4.56 (3.16, 6.04) | 4.52 (3.63, 6.58) | 5.06 (3.59, 6.68) | 4.29 (3.07, 5.32) | |
| PT (s) | 12.00 (11.00, 13.20) | 12.10 (11.05, 13.38) | 11.60 (10.90, 12.90) | 11.90 (10.85, 13.78) | 12.20 (11.60, 13.10) | |
| APTT (s) | 26.05 (23.37, 29.83) | 26.00 (23.35, 29.65) | 27.10 (23.70, 29.80) | 26.30 (23.40, 31.10) | 25.90 (23.40, 28.60) | |
| INR | 1.05 (0.95, 1.16) | 1.05 (0.95, 1.16) | 1.01 (0.95, 1.13) | 1.05 (0.94, 1.33) | 1.06 (1.01, 1.13) | |
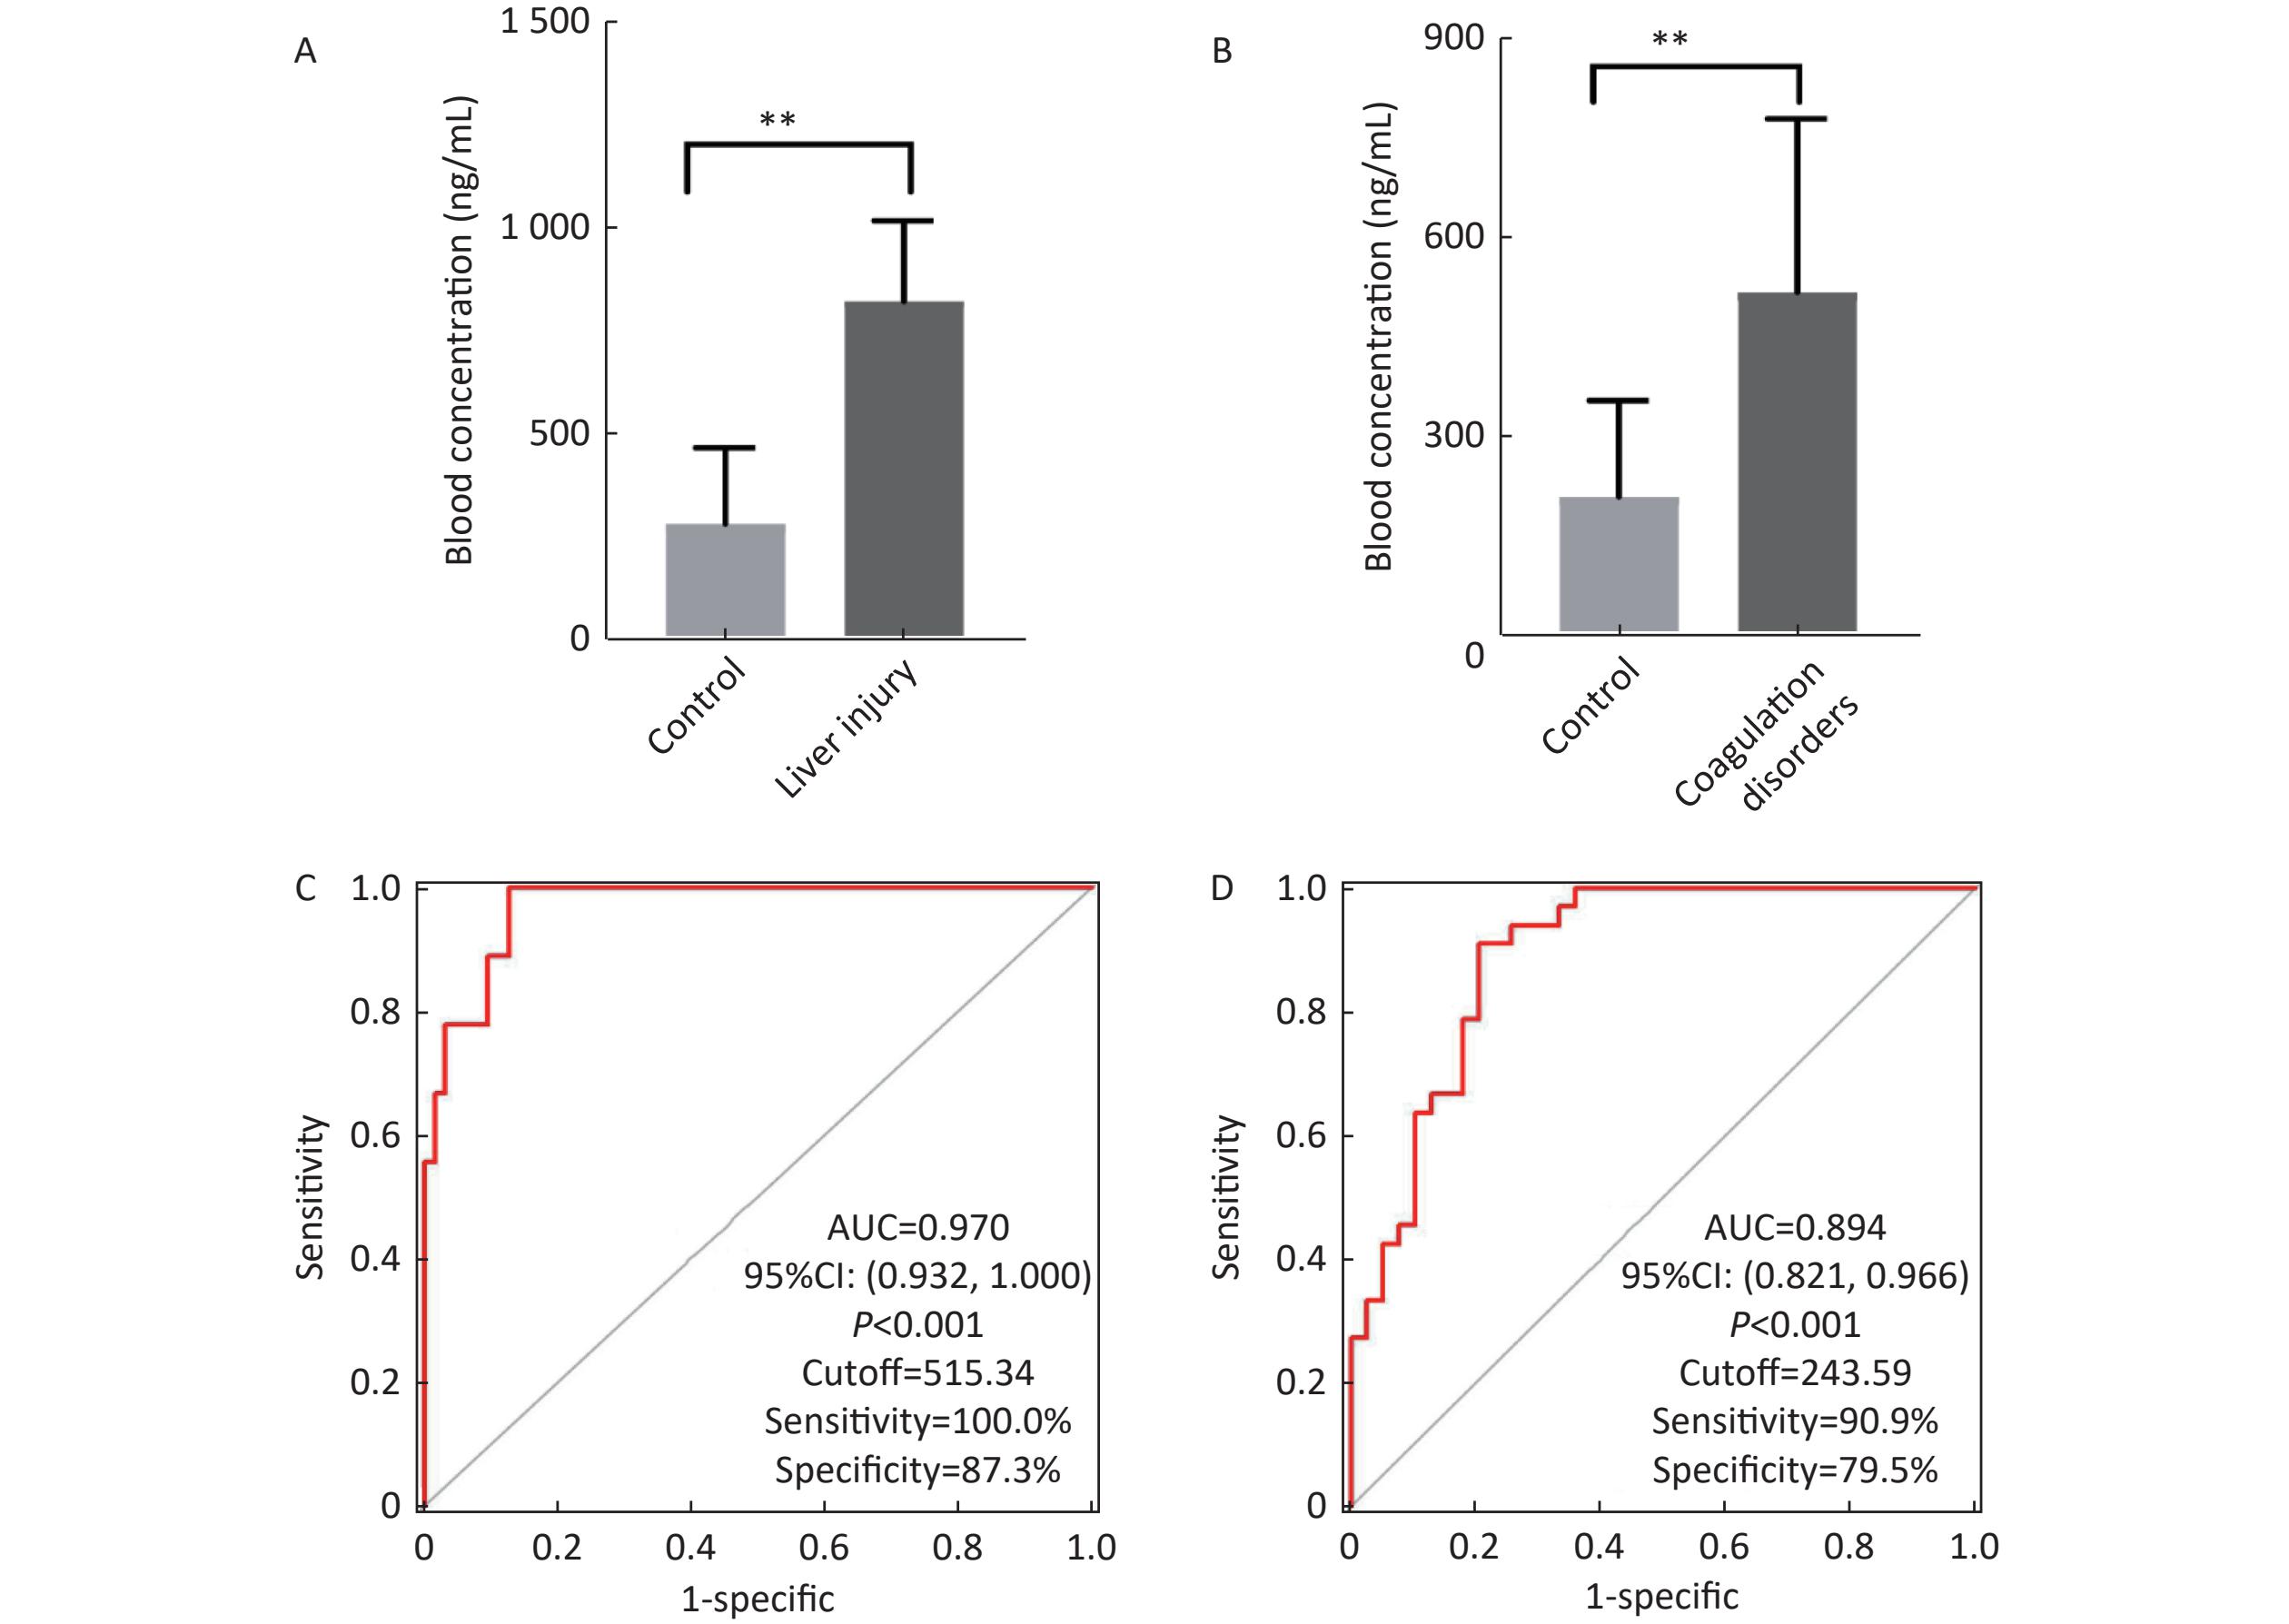
图 4
Fig.4 (A) Comparison of blood drug concentration in the normal group-hepatic injury group; (B) Comparison of blood drug concentration in the normal group-coagulation disorder group; (C) ROC plot of TGC-induced coagulation dysfunction versus the sixth shot blood concentration; (D) ROC plot of TGC-induced liver injury versus the sixth shot blood concentration. **P<0.01.
| 1 |
Mohamed RAE, Moustafa NM, Mahmoud FM, et al. Whole-genome sequencing of two multidrug-resistant Acinetobacter baumannii strains isolated from a neonatal intensive care unit in Egypt: a prospective cross-sectional study[J]. BMC Microbiol, 2024, 24, 362.
doi: 10.1186/s12866-024-03482-3 |
| 2 |
Korczak L, Majewski P, Rombel K, et al. In vitro evaluation of tigecycline synergy testing with nine antimicrobial agents against Enterobacter cloacae clinical strains[J]. Front Microbiol, 2024, 15, 1490032.
doi: 10.3389/fmicb.2024.1490032 |
| 3 |
Fan XY, Jiang Y, Wu H, et al. Distribution and spread of tigecycline resistance gene tet(X4) in Escherichia coli from different sources[J]. Front Cell Infect Microbiol, 2024, 14, 1399732.
doi: 10.3389/fcimb.2024.1399732 |
| 4 |
Shi X, Lao D, Xu Q, et al. A case report of drug-induced liver injury after tigecycline administration: histopathological evidence and a probable causality grading as assessed by the updated RUCAM diagnostic scale[J]. BMC Infect Dis, 2022, 22, 368.
doi: 10.1186/s12879-022-07258-w |
| 5 |
Li M, He J, Dong G, et al. Serum concentration threshold and risk factors of tigecycline-induced hypofibrinogenaemia in critically ill patients[J]. J Antimicrob Chemother, 2025, 80 (1): 200- 208.
doi: 10.1093/jac/dkae396 |
| 6 |
Shi X, Zuo C, Yu L, et al. Real-world data of tigecycline-associated drug-induced liver injury among patients in China: a 3-year retrospective study as assessed by the updated RUCAM[J]. Front Pharmacol, 2021, 12, 761167.
doi: 10.3389/fphar.2021.761167 |
| 7 |
Ma C, Ren X, Pang N, et al. Incidence, characteristics, and risk factors of hypofibrinogenemia induced by generic tigecycline: a retrospective study[J]. Naunyn Schmiedebergs Arch Pharmacol, 2025, 398 (3): 2717- 2727.
doi: 10.1007/s00210-024-03419-7 |
| 8 | Qian Z, Jine W, Hui L, et al. Risk factors for tigecycline-induced hypofibrinogenaemia[J]. J Clin Pharm Ther, 2020, 45 (6): 1434- 1441. |
| 9 |
Cui N, Cai H, Li Z, et al. Tigecycline-induced coagulopathy: a literature review[J]. Int J Clin Pharm, 2019, 41 (6): 1408- 1413.
doi: 10.1007/s11096-019-00912-5 |
| 10 |
Yu M, Wu S, Qi B, et al. Rational use of tigecycline and tigecycline blood concentration monitoring in patients with severe infection[J]. Biomed Rep, 2023, 19 (2): 51.
doi: 10.3892/br.2023.1634 |
| 11 |
Wang C, Luo B, Liu W, et al. Development and clinical utility of an ultra performance liquid chromatography–tandem mass spectrometry assay for monitoring omadacycline and tigecycline in severe bacterial infections[J]. J Mass Spectrom Adv Clin Lab, 2024, 34, 46- 54.
doi: 10.1016/j.jmsacl.2024.11.001 |
| 12 |
Galvidis IA, Surovoy YA, Tsarenko SV, et al. Tigecycline immunodetection using developed group-specific and selective antibodies for drug monitoring purposes[J]. Biosensors, 2023, 13 (3): 343.
doi: 10.3390/bios13030343 |
| 13 |
Atallah E, Wooten JW, Orman OC, et al. Incidence, risk factors and outcomes of checkpoint inhibitor-induced liver injury: a 10-year real-world retrospective cohort study[J]. JHEP Rep, 2023, 5 (10): 100851.
doi: 10.1016/j.jhepr.2023.100851 |
| 14 |
Ciricillo J, Myer A, Yeboah-Korang AY, et al. Improving the diagnostic accuracy of RECAM in North American patients with suspected idiosyncratic drug-induced liver injury[J]. Am J Gastroenterol, 2025, 120 (6): 1325- 1333.
doi: 10.14309/ajg.0000000000003147 |
| 15 |
Mahdavijalal M, Petio C, Staffilano G, et al. Innovative solid-phase extraction strategies for improving the advanced chromatographic determination of drugs in challenging biological samples[J]. Molecules, 2024, 29 (10): 2278.
doi: 10.3390/molecules29102278 |
| 16 |
Paul R, Ostermann E, Wei Q. Advances in point-of-care nucleic acid extraction technologies for rapid diagnosis of human and plant diseases[J]. Biosens Bioelectron, 2020, 169, 112592.
doi: 10.1016/j.bios.2020.112592 |
| 17 | Ruiz J, Ramirez P, Villarreal E, et al. Effect of pharmacokinetic/pharmacodynamic ratio on tigecycline clinical response and toxicity in critically ill patients with multidrug-resistant Gram-negative infections [J]. SAGE Open Med, 2020, 8: 2050312120958897. |
| 18 |
Liu YX, Le KJ, Shi HY, et al. Efficacy and safety of tigecycline for complicated urinary tract infection: a systematic review[J]. Transl Androl Urol, 2021, 10 (1): 292- 299.
doi: 10.21037/tau-20-959 |
| 19 |
Chen Z, Shi X. Adverse events of high-dose tigecycline in the treatment of ventilator-associated pneumonia due to multidrug-resistant pathogens[J]. Medicine (Baltimore), 2018, 97 (38): e12467.
doi: 10.1097/md.0000000000012467 |
| 20 |
Guo M, Liang J, Li D, et al. Coagulation dysfunction events associated with tigecycline: a real-world study from FDA adverse event reporting system (FAERS) database[J]. Thromb J, 2022, 20 (1): 12.
doi: 10.1186/s12959-022-00369-z |
| 21 |
Lei Z, Chen X, Pan F, et al. Comparison of bleeding risk and hypofibrinogenemia-associated risk factors between tigecycline with cefoperazone/sulbactam therapy and other tigecycline-based combination therapies[J]. Front Pharmacol, 2023, 14, 1182644.
doi: 10.3389/fphar.2023.1182644 |
| 22 |
Leng B, Xue YC, Zhang W, et al. A retrospective analysis of the effect of tigecycline on coagulation function[J]. Chem Pharm Bull, 2019, 67 (3): 258- 264.
doi: 10.1248/cpb.c18-00844 |
| 23 |
Yu Z, Zhao Y, Jin J, et al. Prevalence and risk factors of tigecycline-induced liver injury: a multicenter retrospective study[J]. Int J Infect Dis, 2022, 120, 59- 64.
doi: 10.1016/j.ijid.2022.04.024 |
| 24 |
Jiang T, He X, Li Q, et al. Risk factors for tigecycline-associated hepatotoxicity in patients in the intensive care units of two tertiary hospitals: a retrospective study[J]. J Clin Pharmacol, 2022, 62 (11): 1426- 1434.
doi: 10.1002/jcph.2099 |
| 25 |
Liu J, Yan Y, Zhang F. Risk factors for tigecycline-associated hypofibrinogenemia[J]. Ther Clin Risk Manag, 2021, 17, 325- 332.
doi: 10.2147/TCRM.S302850 |
| 26 |
Guo J, Wang S, Zhou M, et al. Nomogram for the prediction of tigecycline-induced hypofibrinogenaemia in a Chinese population[J]. Int J Antimicrob Agents, 2024, 63 (2): 107062.
doi: 10.1016/j.ijantimicag.2023.107062 |
| 27 |
Su W, Song S, Liu J, et al. Population pharmacokinetics and individualized dosing of tigecycline for critically ill patients: a prospective study with intensive sampling[J]. Front Pharmacol, 2024, 15, 1342947.
doi: 10.3389/fphar.2024.1342947 |
| 28 |
Taubert M, Wicha SG, Frey OR, et al. Tigecycline in critically ill patients on continuous renal replacement therapy: a population pharmacokinetic study[J]. Crit Care, 2018, 22 (1): 341.
doi: 10.1186/s13054-018-2278-4 |
| 29 |
Burón C, Hernández M, Cazorla M, et al. Tigecycline population pharmacokinetics in critically ill patients with decompensated cirrhosis and severe infections[J]. J Antimicrob Chemother, 2022, 77 (5): 1332- 1338.
doi: 10.1093/jac/dkac036 |
| 30 |
Zhou CC, Huang F, Zhang JM, et al. Population pharmacokinetics of tigecycline: a systematic review[J]. Drug Des Devel Ther, 2022, 16, 1885- 1896.
doi: 10.2147/DDDT.S365512 |
| 31 |
Cojutti P, Giangreco M, Isola M, et al. Limited sampling strategies for determining the area under the plasma concentration–time curve for isoniazid might be a valuable approach for optimizing treatment in adult patients with tuberculosis[J]. Int J Antimicrob Agents, 2017, 50 (1): 23- 28.
doi: 10.1016/j.ijantimicag.2017.01.036 |
| 32 |
Misaka S, Maejima Y, Shimomura K. Limited sampling strategy for predicting the area under plasma concentration–time curve of nadolol in healthy subjects[J]. J Clin Pharmacol, 2024, 65 (5): 621- 627.
doi: 10.1002/jcph.6164 |
| 33 |
Chen Q, Thompson J, Hu Y, et al. High-dose metformin treatment to inhibit complex I during early reperfusion protects the aged mouse heart via decreased mitochondrial permeability transition pore opening[J]. J Pharmacol Exp Ther, 2024, 392 (3): 100529.
doi: 10.1016/j.jpet.2024.100529 |
| [1] | 尹新新, 谢昌鹏, 李雪静, 张丽萍, 苏占海, 王海燕, 吴穹, 潘元明, 安娟. 干细胞外泌体介导线粒体与脂肪酸代谢修复肝细胞损伤的作用机制[J]. 中国临床药理学与治疗学, 2026, 31(9): 1162-1172. |
| [2] | 叶茜, 刘一乔, 吴轩宇, 王一琪, 李帆, 李宏宇, 孟祥云, 王凤玲. 达格列净二甲双胍缓释片在中国健康受试者的等效性研究[J]. 中国临床药理学与治疗学, 2026, 31(9): 1231-1237. |
| [3] | 方怡萌, 雷昕宜, 马思涵, 石文博, 岑露泽, 代曼云. 雷公藤甲素通过激活JNK通路诱发肝细胞损伤的机制研究[J]. 中国临床药理学与治疗学, 2026, 31(8): 1027-1033. |
| [4] | 吴瑛, 许志玮, 李华芳, 沈一峰, 黄志伟, 李妍. 二十碳五烯酸乙酯在中国健康受试者中单次、多次给药的药代动力学及安全性研究[J]. 中国临床药理学与治疗学, 2026, 31(8): 1070-1075. |
| [5] | 王玮辰, 马雅萍, 王萌, 李庆林, 程卉. 基于CYP7A1/FXR/SHP途径探究大黄素对胆汁淤积性肝损伤小鼠的治疗作用[J]. 中国临床药理学与治疗学, 2026, 31(2): 204-212. |
| [6] | 戚大可, 车津晶. 透皮贴剂经皮递送PBPK模型建模方法概述[J]. 中国临床药理学与治疗学, 2026, 31(2): 223-239. |
| [7] | 刘媛, 崔诚, 余淼, 金文煜, 白银亮, 段雅彬, 方草, 贺建昌, 何艳, 黄桦, 霍仕霞, 金阳, 姜林, 姜哲, 焦正, 李学军, 李向阳, 李红健, 刘丽宏, 刘洋, 丘宏强, 孙凤, 孙建军, 王学昌, 王建华, 王振磊, 魏世杰, 颜晓文, 张雷, 张学农, 张宇馨, 赵军, 尹继业, 燕茹, 王新春, 刘东阳. 中国多民族人群精准用药研究价值与策略专家共识[J]. 中国临床药理学与治疗学, 2026, 31(1): 1-13. |
| [8] | 王琰, 夏玉明, 朱仁弟, 欧阳紫微, 程远志, 周仁鹏, 胡伟. 利托那韦片在中国健康受试者中的生物等效性试验[J]. 中国临床药理学与治疗学, 2025, 30(9): 1193-1199. |
| [9] | 魏园园, 马涛, 唐跃洲, 李琥波, 田晓瑜, 党云洁, 周旭. 基于生理药代动力学模型的维生素D个体化给药方案研究[J]. 中国临床药理学与治疗学, 2025, 30(8): 1067-1075. |
| [10] | 曾祥昌, 饶泰, 陈露露, 李超鹏, 曾贵荣, 陈军, 欧阳冬生. 药物性肝损伤的免疫遗传学机制研究进展[J]. 中国临床药理学与治疗学, 2025, 30(8): 1133-1146. |
| [11] | 何怡然, 何阳, 邓国艳, 樊志强, 汤紫照, 魏凤, 欧阳林旗. 蛇床子素通过上调Tif1γ抑制TGF-β1/ Smad通路保护APAP诱导的小鼠肝损伤[J]. 中国临床药理学与治疗学, 2025, 30(7): 889-898. |
| [12] | 田嬿, 杨心怡, 林双双, 何金杰, 王晶晶, 魏琼, 黄星星, 武晓捷. 单次口服YZJ-3058片在中国健康受试者中的安全性、药代动力学及药效动力学研究[J]. 中国临床药理学与治疗学, 2025, 30(6): 796-803. |
| [13] | 谢婧娴, 杜建军, 陈璐, 张丽娟, 杨勇. 艾沙康唑特殊人群药代动力学研究进展[J]. 中国临床药理学与治疗学, 2025, 30(5): 709-713. |
| [14] | 邓艳茹, 曹格溪, 李颖, 李亚静, 董占军. 钠-葡萄糖共转运蛋白2抑制剂药动学相互作用研究进展[J]. 中国临床药理学与治疗学, 2025, 30(4): 570-576. |
| [15] | 张茜, 杨晶晶, 吴娟, 章钦, 秦慧玲, 于亮, 杜益君, 胡伟. 正葡萄糖钳夹技术评价人胰岛素注射液在中国健康受试者的药动学和药效学临床研究[J]. 中国临床药理学与治疗学, 2025, 30(3): 385-391. |
| 阅读次数 | ||||||
|
全文 |
|
|||||
|
摘要 |
|
|||||